Graphic Materials
GRAPHIC
MATERIALS
- Graphic materials translate abstract ideas and
relationships into a concrete form.
- They are non-photographic, two-dimensional materials
designed to communicate a message to the viewer.
- They often include verbal as well as visual symbols.
- Graphics allow students to pick up on things missed
verbally, reduce efforts in receiving messages, and they help focus attention.
- As a group, graphics demands special caution in use by
teachers because images are usually symbolic rather than representational that
they leave a room for misinterpretation
on the intended meaning (Heinich, R., Molenda, M., & Russell, D., 1993)
Advantages:
·
It is readily available.
·
It can be easily carried from place to place.
·
It is easy to use.
·
It is inexpensive and can be reused.
·
It helps focus attention.
·
These convey certain types of information in a
condensed form.
Limitations:
·
This is not interactive.
·
It lacks depths and motion.
·
It can easily be misinterpreted.
·
This is written at a certain reading level.
·
It needs prior knowledge in order to interpret or
understand what is presented.
Best
Practices in Using Graphics:
·
Use large visuals.
·
Use simple materials.
·
Cover irrelevant materials.
·
Use one at a time.
·
Teach learners how to interpret.
·
Ask questions for clarifications.
1. Drawings and Sketches
·
Drawings and sketches employ the use of lines, either
simple or crude.
·
They may not be the real thing but they may represent
persons, places, things, and concepts.
·
Drawings are more finished and representational
2. Cartoons
·
use symbolism and oftentimes bold exaggerations to
present at a glance a message or point concerning news events, people or
situations
·
This pictorial representation of a person, idea or
situation should be drawn around a single idea and presented in a challenging
manner.
·
A good cartoon needs not much caption as the symbolism
conveys the message.
Suggestions
for the Use of Cartoons (Garo, 2007):
·
Take into consideration the age and experience or
maturity of the target learners.
·
The cartoon should not contain so many details but
only the essential features.
·
Short and direct captions are used only when
necessary.
·
Use symbols that are clear and conventional.
o dove
for peace
o owl
for wisdom
o coffin
for death
o turtle
for slow, etc
·
Make sure that the cartoon is big enough to be seen.
3. Strip Drawings
·
a form of cartooning in which a cast of characters
enacts a story in a sequence of closely related drawings.
·
a more accurate term for the commonly called comics or
comic strip (Dale, 1969)
·
can be used as an activity for students to express
learning gained
·
When making use of strip drawings, make sure that they are not only educational but
also entertaining.
4. Posters
·
are combination of lines, images, colors, and words
·
They are intended to catch attention and communicate a
message quickly.
·
Posters can be used to stimulate interest in a new
topic, a special class, or a new event.
·
In selecting a poster to use, make sure that it is appropriate to the grade level, subject,
and purpose.
A good
poster possesses the following characteristics (Garo, 2007):
§ It
is simple but bold and dramatizes features.
§ Only
a few words are used and key words are made to standout.
§ It
is attractive and pleasing to the eyes.
§ The
design and color are carefully selected.
- It must have elements of dynamism and shock.
5. Charts
Charts are graphic
representation of abstract relationship such as chronologies, quantities, and
hierarchies.
TYPES OF CHARTS:
Organization Chart
These show
an organization’s structure or chain of command. It illustrates the interrelationships
between the different parts of an organization.
Limitations:
¢ They
can quickly become out of date
¢ They
show only formal relationship
¢ They
don’t reflect management style
Classification Chart
¢ Show
the classification or categorization of objects, events, or species.
Time Lines
¢ Time
lines show in sequence different events or the people and events. It is a
graphic design showing a long bar labelled with dates alongside itself and
usually events labelled on points where they would have happened.
Uses of
timelines
·
Students will be able to understand the chronology of
historic events.
·
Provide visual aid for identifying cause and effect
relationship.
·
Visual prompt to activate student’s prior knowledge.
Tabular Charts or Tables
¢ They
contain numerical information or data in a table or columns by means of
arranging data in rows and columns.
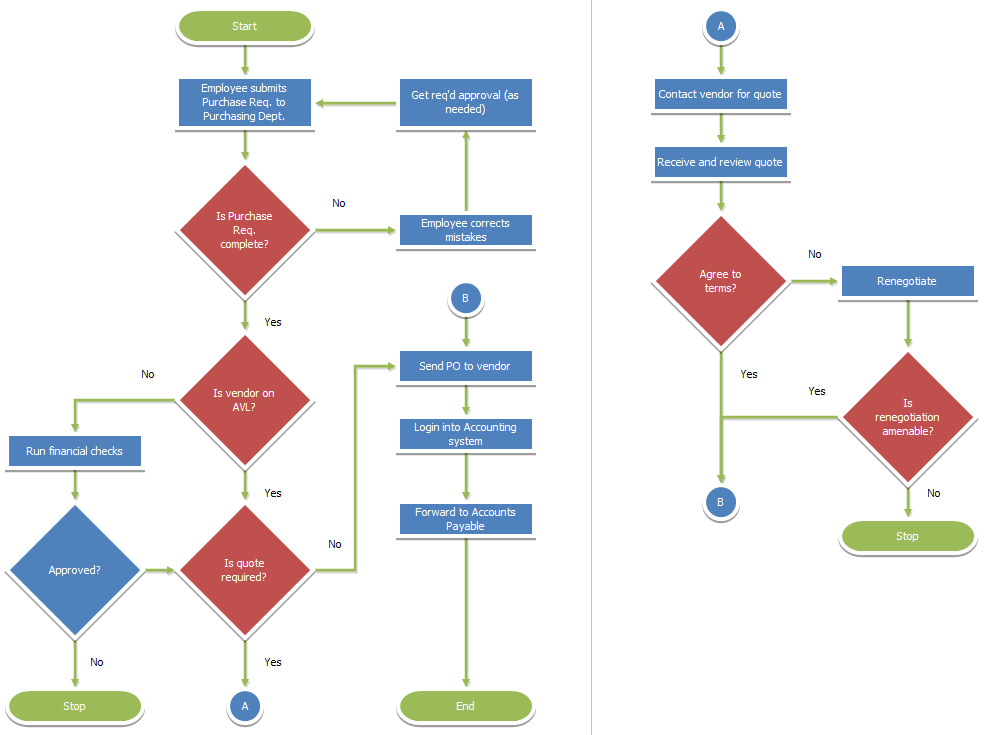
Flowcharts or Process Charts
¢ It
is a diagram that uses algorithm, workflow showing the steps as boxes of
various kinds and their order by
connecting them with arrows, which demonstrate a process, sequence or
procedure.
Tree or stream Charts
¢ These
kinds of chart show change, growth or development by beginning with a single
course and then spreads out into many branches or by beginning with many
branches which then come together into a single channel.
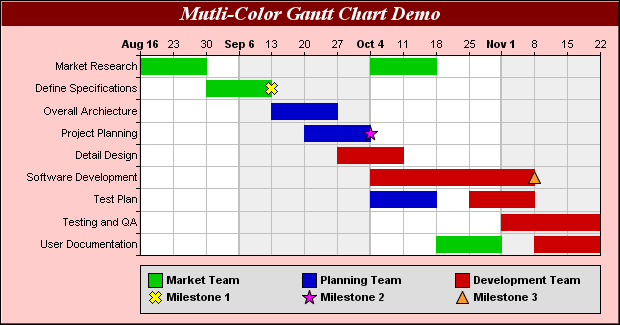
Gannt Charts
¢ is
an activity time chart, that illustrates the start and finish dates of a
certain activity or project.
6. Graphs
¢ Graphs show quantitative data.
These kinds of graphics make analysis and interpretation of numerical
information easier.
¢ The following are the most common
types of graphs:
— Line Graphs
— Bar Graphs
— Pie Graph or Circle Graph
— Area or Solid Graphs
— Pictorial Graphs or Pictographs
BAR GRAPHS
¢ Bar graphs are the simplest and
easiest to read. The data are presented in horizontal or vertical bars. While
the widths of the bars are the same, its length represents the amount or
percentage data.
PIE GRAPH or Circle graph
¢ The sections of these kinds of
graphs represent the parts of a whole. These graphs always present whole
amounts and its parts are calculated in percentage or fractional parts.
Area or solid graphs
¢ They are used to compare several
related totals thru the use of geometric shapes.
Pictorial graphs or pictographs
¢ These graphs utilize related
pictures or drawings to show numerical data. It is an adaptation of the bar
graph.
7.
Diagrams
¢ Diagrams are intended to show
relationships or to help explain a process, how something works or how
something is constructed.
¢ A diagram is any line drawing
that shows arrangement and relations as of parts of the whole, relative values,
origins and development, chronological fluctuations, distributions, etc. (Dale,
1969)
¢ The following are some examples
of diagrams:
— Cluster or Cloud Diagram
— Chain of Events
— Fishbone Mapping
— Cycle
— Compare/Contrast
— Venn Diagram
Cluster or cloud diagram
¢ This is used in a nonlinear
activity wherein ideas, images, and feelings are generated around a stimulus
word. It helps students see patterns in their ideas and help systematize the
generation of ideas based upon a central topic.
Chain of events
¢ The diagram illustrates the
stages of an event, the actions of a character or the steps in a procedure.
Fishbone mapping
¢ A fishbone map is used to show
causal interaction of a complex event (like a nuclear explosion) or a complex
phenomenon (like learning disabilities).
Cycle
¢ A cycle illustrates how series of
events interact to produce a set of results such as the life cycle.
Compare/contrast
¢ A diagram that is used to show
similarities and differences.
Venn diagram
¢ A venn diagram is used to show
relationships between sets, similarities and differences between characters,
stories or poem. It enables the students to visually organize similarities and
differences.


